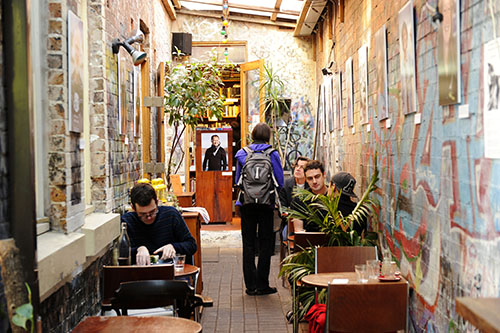
Sydney economy, tourism boosted by F&B infrastructure
SYDNEY has had an unprecedented decade of growth in its food and beverage (F&B) industries and that has positively transformed both the city’s hospitality economy and tourism appeal.
According to a City of Sydney report, from 2007-2017, the number of hospitality businesses in Sydney has jumped by around 45 percent, cementing the city’s status as one of the world’s great food and beverage destinations.
City of Sydney’s latest floor space and employment survey, which details the employment and floor space of every business in the City of Sydney area, showed the sector to be thriving in every respect.
“The results show that the City of Sydney is the epicentre of jobs and growth in Australia,” Sydney Lord Mayor Clover Moore said. “By creating a city where people come first, we've seen that jobs and new businesses also follow. 
“To attract high-value businesses with good paying jobs, you need to attract employees. The strength of local communities is a key attraction for people choosing where to live, work or visit.
“High quality developments close to jobs, shops and transport, efficient transport and safe and attractive ways for people to move around, childcare, stunning community facilities, beautiful parks and open spaces, quirky laneways, small bars, main streets with thriving small businesses – these are all things we've actively pursued over the last 14 years.
“It's also important that the city is a welcoming, multicultural community where people feel included.
“Our recent results show that our hospitality industry is thriving. The number of food and drink businesses in our city has increased by 972 in the decade from 2007 to 2017.
“The number of workers and cafés also increased in the last decade, alongside restaurant seating capacity which rose by a phenomenal 50 percent, from 55,239 in 2007 to 83,045 in 2017.
“Alongside our late night development control plan, currently on public exhibition, we are looking to diversify the activity we see in our city after dark – further boosting our night-time economy.”
The survey results also reveal an increase of two-thirds in the number of restaurants from 727 in 2007 to 1,217 in 2017. There has also been a significant rise of around one third of food and drink workers over the 10-year period from 2007 to 2017, despite a slight decline in the number of food and drink workers since 2012.
In Sydney today, however, the average restaurant now employs nine workers compared with 12 in 2012 and 2007, and that corresponds with a 38 percent rise in the number of cafes from 761 in 2007 to 1049 in 2017.
City of Sydney’s manager of urban analytics Steve Hillier said the data suggested a greater appetite for eating out, with greater choice, number and variety of eateries.
“Restaurants and cafes are growing at a faster pace than our population and worker growth, which suggests a greater demand for eating out,” Mr Hillier said.
“The number of workers hasn’t kept pace with the growing number of establishments and that’s probably a reflection of the hospitality industry’s well documented issues attracting staff.”
Chinatown and CBD South recorded the strongest food and drink business growth over the decade, with 198 additional (42 percent increase), followed by the CBD and Harbour growing by 171 businesses (19.5 percent increase) and Green Square and City South with 149 additional businesses (104 percent increase).
BY THE NUMBERS
Hospitality workers
|
2007 |
2012 |
2017 |
|
|
Cafes |
4,419 |
5,781 |
5,631 |
|
Restaurants |
8,473 |
11,666 |
11,302 |
|
Takeaway food services |
2,924 |
3,741 |
3,495 |
|
Other food and drink services |
460 |
1,149 |
481 |
|
Pubs, taverns and bars |
4,177 |
5,304 |
4,431 |
|
Clubs and casinos |
3,291 |
3,913 |
4,372 |
|
Totals |
23,744 |
31,554 |
29,712 |
Hospitality business numbers
|
2007 |
2012 |
2017 |
|
|
Cafes |
761 |
912 |
1,049 |
|
Restaurants |
727 |
1,002 |
1,217 |
|
Takeaway food services |
529 |
624 |
660 |
|
Other food and drink services |
22 |
33 |
85 |
|
Pubs, taverns and bars |
253 |
310 |
346 |
|
Clubs and casinos |
50 |
57 |
37 |
|
Totals |
2,342 |
2,938 |
3,394 |
ends

 How to resolve AdBlock issue?